Using the Purple Mountain Observatory Delingha 13.7 m millimeter-wavelength telescope, we studied the molecular environments toward three large SNRs G205.5+0.5,G206.9+2.3, and G213.0–0.6 in the third Galacticquadrant. COemission was detected toward the three remnants. Especially, both of SNRs G205.5+0.5 and G213.0–0.6 exhibit the morphological agreement between SNRs and their surrounding MCs, as well as kinematic signatures of shock perturbation in the molecular gas, confirming that the two SNRs are interacting with their surrounding clumpy molecular gas. Moreover, SNR G205.5+0.5 is found to be related to its southern Rosette Nebula and the 5km/s giant MCs. On the other hand, SNR G213.0–0.6 has no relation to its southwestern HII region Sh 2-284. For SNR G206.9+2.3, it is suggested to be associated with the 15km/s CO gas shell and seems to be still evolving in the molecular cavity. The distances of SNRs G205.5+0.5, G206.9+2.3, and G213.0–0.6 are estimated to be 1.6, 1.0, and 1.6 kpc, respectively. Other physical properties of individual SNRs, together with the relationship between the remnants and their nearby objects, are also discussed. Our research suggests that the association between SNRs and its ambient molecular environment is very common in the Milky Way.
Out study has greatly benefitted from the Milky Way Imaging Scroll Painting Project (MWISP), which is a large, unbiased, and high-quality CO and its isotopes survey from Galactic longitude of -10 to 250 degrees and Galactic latitudes from -5 to 5 degrees. The CO data with high spatial (~50'') and velocity (~0.2km/s) resolution provide us with a good opportunity in studying the molecular environment of extended sources from large scale to small scale. The paper was published in the Astrophysical Journal (2017, ApJ, 836, 211). Detailed information of the paper can be found at: http://adsabs.harvard.edu/abs/2017ApJ...836..211S
By with SU Yang
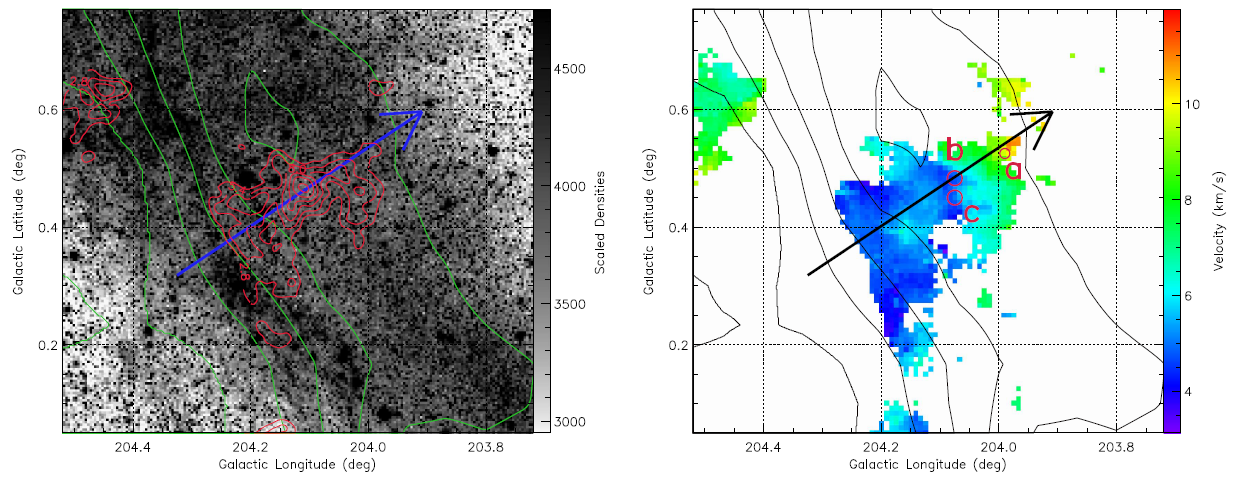
Figure . Left panel: optical image (the Digitized Sky Survey, Lasker et al. 1990) toward the western boundary of SNR G205.5+0.5, overlaid with green radio contours as in Figure 1. Red contours show the 12CO (J=1–0) distribution (in units of K km s−1) integrated from 3 to 12kms−1. The arrow indicates the PV slice shown in Figure 7. Right panel: intensity-weighted 12CO (J=1–0) mean velocity (first moment) map of MCs in the interval of 3–12kms−1, overlaid with the same radio contours as in the left panel. Positions and sizes of shocked gas (see spectra in Figure 8) are also labeled.


