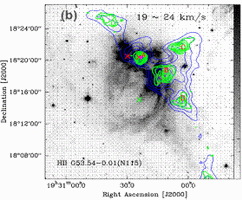
Using 13.7 m radio telescope of Purple Mountain Observatory (PMO), authors from National Astronomical Observatory (NAO) and PMO conducted CO observations towards HII region G53.54-0.01 (N115). They found that the 8 um emission associated with H II region G53.54-0.01 should belong to the foreground emission, and only overlap with the large-scale infrared bubble in the line of sight. C18O J=1-0 emission presents four cloud clumps on the northeastern border of H II region G53.54-0.01. Via comparing the spectral profiles of 12CO J=1-0, 13CO J=1-0, and C18O J=1-0 peak at each clump, they found the collected gas in the three clumps, except for the clump A coincided with a massive YSO (IRAS 19282+1814). Furthermore, they identified an outflow only in the clump A. The estimated mass of clump A indicating a forming massive star. They suggested that the collected gas expands into the pre-existing clump A, the local density of clump A increases then it collapse to be a massive star.
This paper has been accepted for publication in A&A, available at http://arxiv.org/abs/1407.6819. (A) 13CO J=1-0 GRS integrated intensity contours (blue and red) overlapped on the Spitzer-IRAC 8 m emission map (grey
scale).
(B) The Spitzer-IRAC 8 m emission map (grey scale) superimposed on 13CO J=1-0 (blue contours) and
C18O J=1-0 (green contours) intensity maps. Letters A, B, C, and D indicate the detected molecular clumps.
(C) 12CO J=1-0, 13CO J=1-0, and C18O J=1-0 spectra at the peak position of the molecular clump A.
(D) 12CO J=1-0, 13CO J=1-0, and C18O J=1-0 spectra at the peak position of the molecular clump B.
By with for SUN Yan
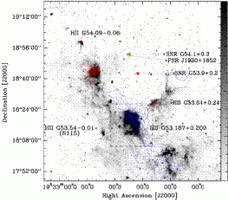
Fig. 1. Left panel: 13CO J=1-0 integrated intensity contours (blue and red) overlayed on the Spitzer-IRAC 8 _m emission map (grey scale). The blue contour levels are 20, 35,... , 95% of the peak value (19.9 K km s1) integrated from 20 to 28 km s1, while the red contour levels are 20, 35,... , 95% of the peak value (26.1 K km s1) integrated from 35 to 43 km s1. The di_erent sources associated with the region are marked. The red and green stars represent the center of SNRs and PSR. The radius of the radio shell is 140 outlined by a dashed circle. The dashed quadrate frame marks the area observed with PMO telescope. The unit of the grey bar is in MJy sr1. Right panel: Average spectra of 13CO J=1-0 over the whole large-scale infrared bubble. The vertical dashed lines in the spectra mark the peak velocity.


