1. Observation Time:2011-4-21 ~ 2011-4-23 8 hours.
2011-5-7 7 hours.
System Temperature:
2011-4-21 ~ 2011-4-23 Tsys of Lower Band: 160 K ~ 239 K;
Tsys of Uper Band: 260 K ~ 441 K
2011-5-7 Tsys of Lower Band: 175 K ~ 235 K;
Tsys of Uper Band : 270 K ~ 390 K
2. Observation Parameter:
|
SOURCE |
NGC2264 |
|
Observation Center |
RA(B1950) : 06:38:10.00
DEC(B1950): +09:40:00.0 |
|
Scans Repeat |
4 |
|
THETAROW (arcsec) |
15 |
|
WIDTH(arcsec) |
1200 |
|
HEIGHT(arcsec) |
6000 |
|
RAMP(acccleratingrcgion)【second of arc】 |
10 |
|
SCANRATE (arcsec/sec) |
75 |
|
TDUMP (sec) |
0.2 |
|
CALRATE Interval (minute) |
3 |
|
OFFINTTIME (sec) |
1.3 |
|
CALINTTIME(sec) |
2 |
3. Results:
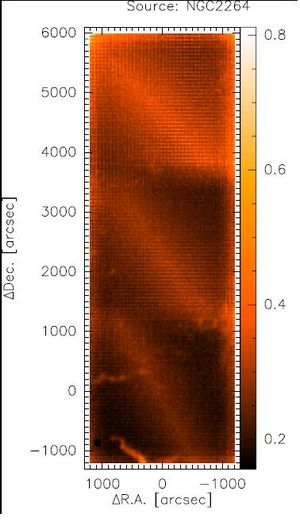
Fig. 1 left panel:integral intensity (Unit in K km s-1) for CO(1-0), velocity range from -4 to -20 km/s;right panel: line noise (Unit in K) per channel for CO(1-0).
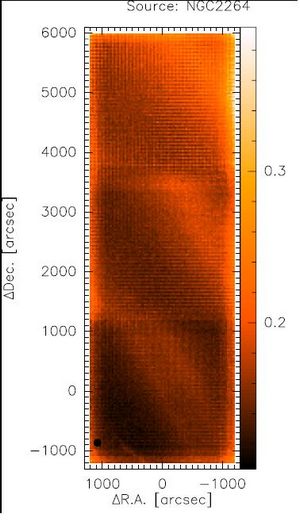
Fig. 2 left panel:integral intensity for 13CO(1-0), velocity range from -4 to -20 km/s;right panel: line noise per channel for 13CO(1-0).

(image or by WU Yuan Wei)
Fig. 3 left panel:integral intensity for C18O(1-0), velocity range from -4 to -20 km/s;right panel: line noise per channel for C18O(1-0).
(image or by WU Yuan Wei)
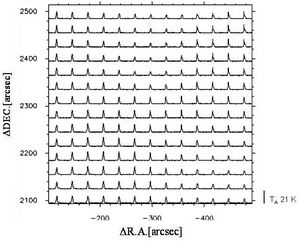
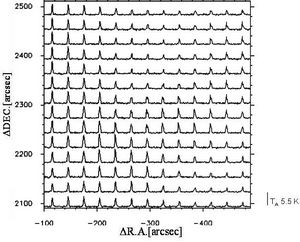
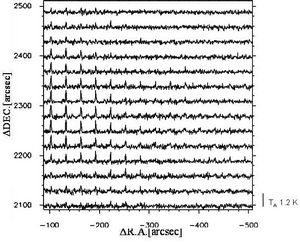
Fig.4: Top, middle and bellows are Spectra map for 12CO(1-0)、13CO(1-0) and C18O(1-0).
(image or by WU Yuan Wei)
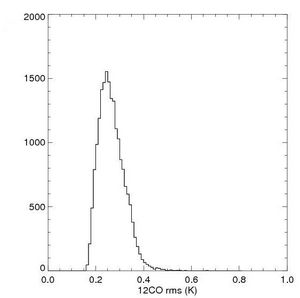
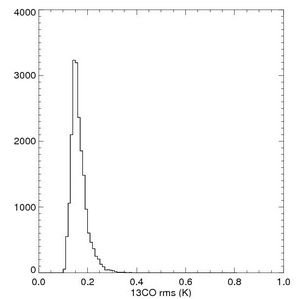
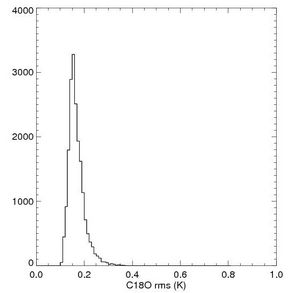
Fig.5 Top, middle and below are rms distributions for 12CO(1-0)、13CO(1-0) and C18O(1-0). The reason for the double peak profile is that rms in the bottom region of NGC2264 are larger than the middle and top region.

